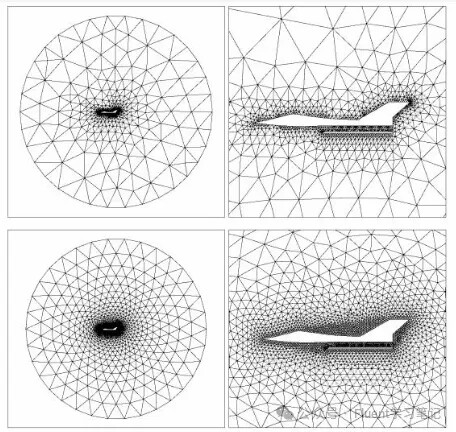
1. Grid Independence
In many CFD research papers, we often see grid independence verification. What is grid independence verification? Why is it necessary? And how can we perform grid independence verification?
2. What is Grid Independence Verification?
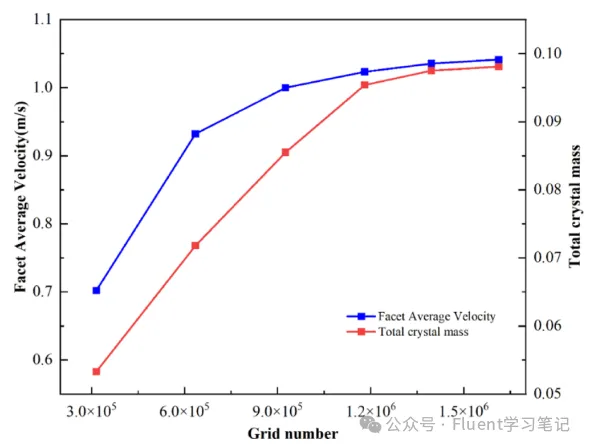
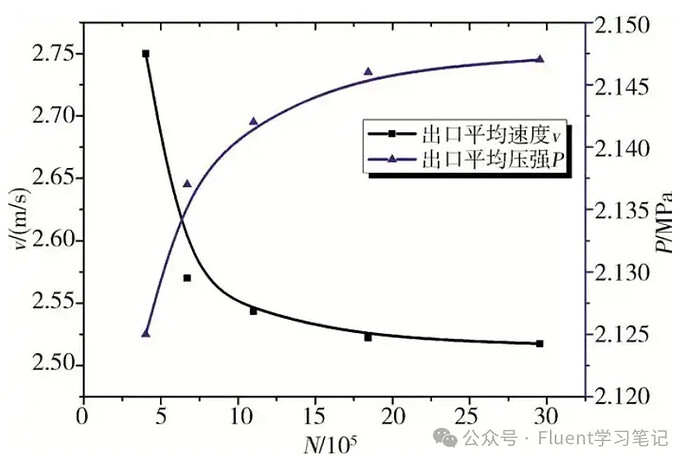
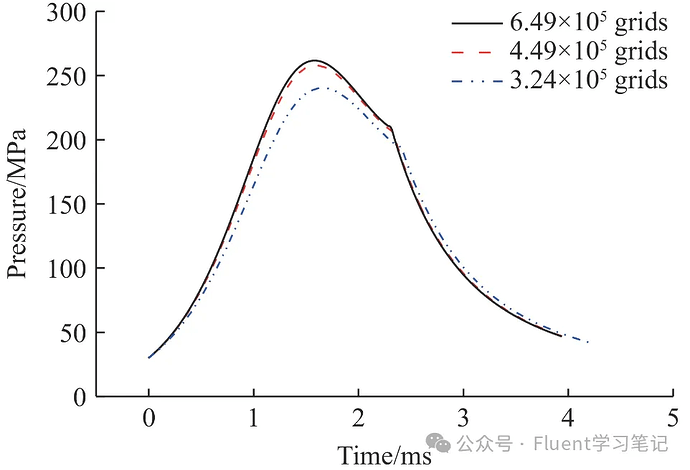
Grid independence verification refers to gradually increasing the number of grids to observe whether the simulation results stabilize. When the simulation results no longer change significantly with increasing grid density, it is considered to have achieved grid independence, meaning the results are no longer influenced by grid density.
Currently, journals accepting numerical simulation papers generally require grid independence verification to ensure that the simulation results are not dependent on grid resolution.
During the solution process, boundary conditions and other parameters are typically kept constant, while the grid is gradually refined. Results from different grid densities are then compared to determine independence.
3. Why is Grid Independence Verification Necessary?
Why do we need grid independence verification? This is because within a certain range, numerical simulation results are related to grid density. But why?
3.1 When the Grid Density is Low
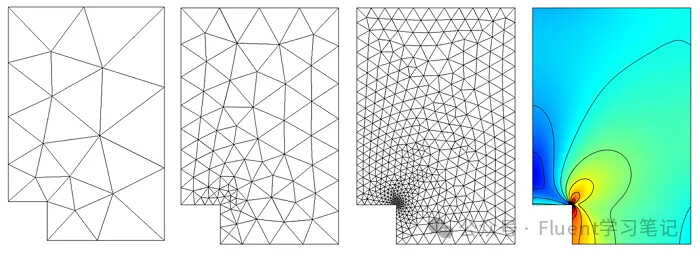
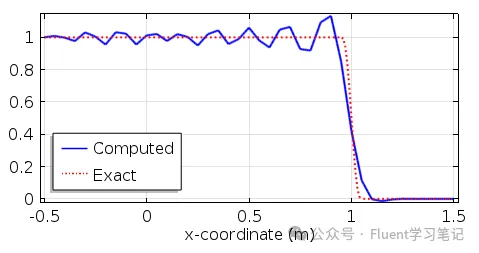
This occurs because numerical simulations divide a continuous space into discrete grids for calculation. The higher the grid density, the finer the discretization, reducing discretization error and making results closer to the actual solution. Conversely, low grid density increases discretization error, reducing calculation accuracy.
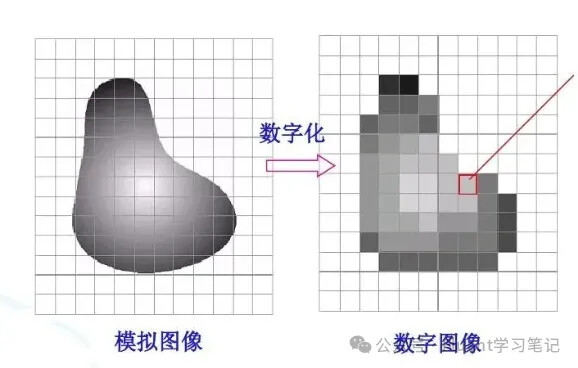
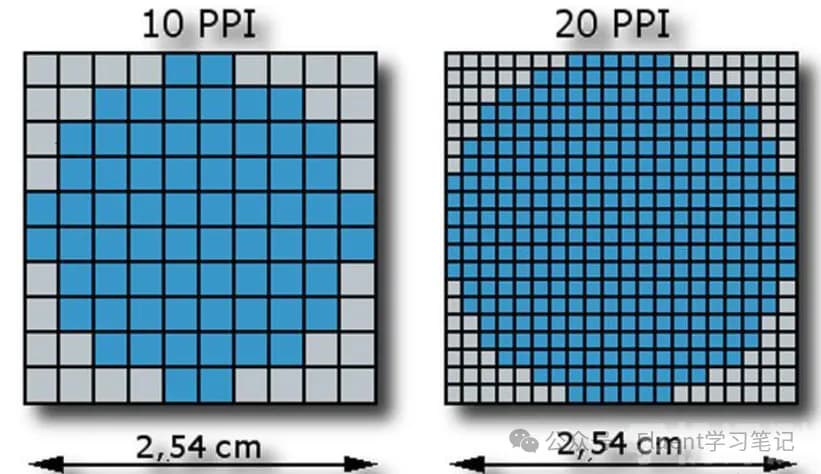
This is similar to the relationship between pixel resolution and image clarity. High-resolution photos are significantly clearer than low-resolution photos. In numerical simulations, a fine grid is like high resolution, while a coarse grid corresponds to a low-resolution image.
Example: Rectangular Model
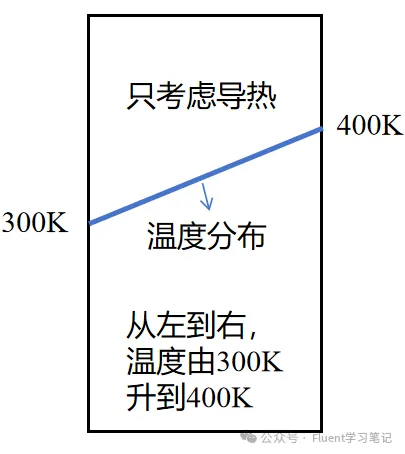
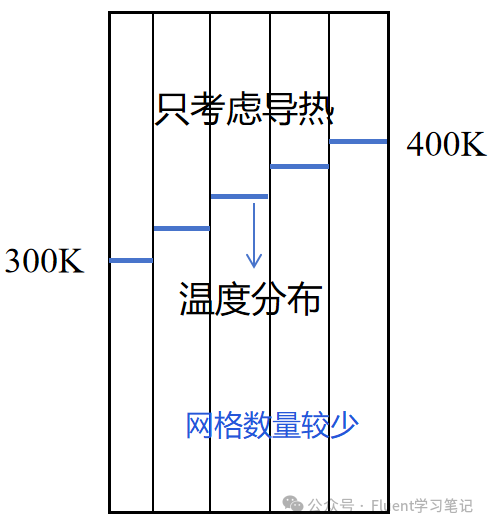
For a rectangular model where the left and right walls are at 300K and 400K respectively, the true temperature distribution along the model should be linear under heat conduction.
-
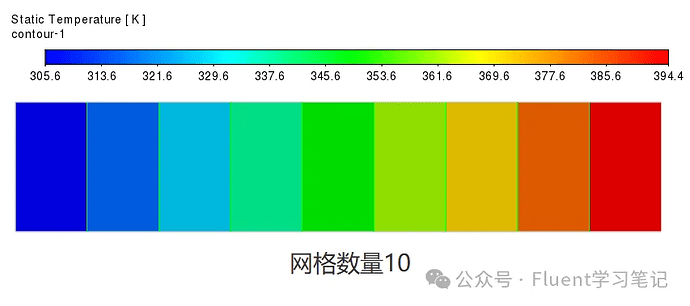
Coarse Grid
With just a few grids, the temperature distribution appears very rough and clearly deviates from the true distribution.
-
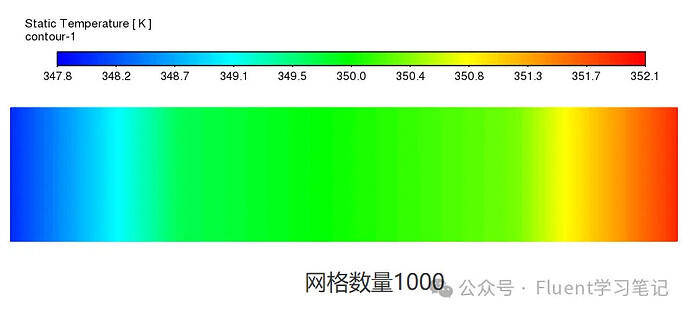
Fine Grid
When the number of grids increases to 1,000, the temperature distribution becomes continuous, and the calculation is more accurate.
Gradient Capture Capability
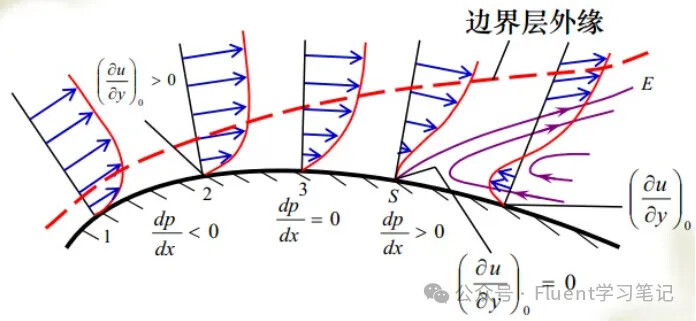
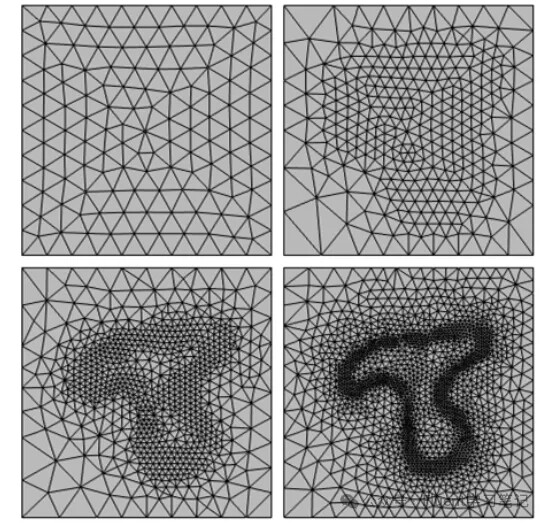
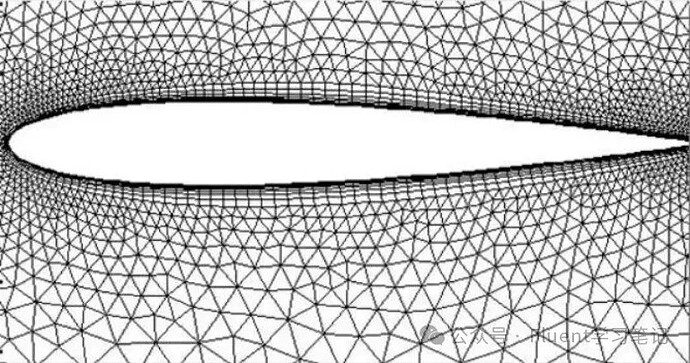
Another reason is the gradient capture capability. In flow fields, especially in regions with sharp variations (e.g., boundary layers, shockwave regions), fine grids are necessary to capture detailed variations. Increasing the grid density can better describe these changes, thus improving simulation accuracy. Coarse grids smooth these areas, leading to errors.
This is also comparable to image resolution. Areas with rich colors and more details require higher resolution, while areas without scenery can use lower resolution.
Similarly, in grid density, regions like boundary layers with high physical gradients require finer grids. Even with the same number of grids, differences in grid detail in these specific regions can result in discrepancies in results.
Example: Circular Pipe Flow
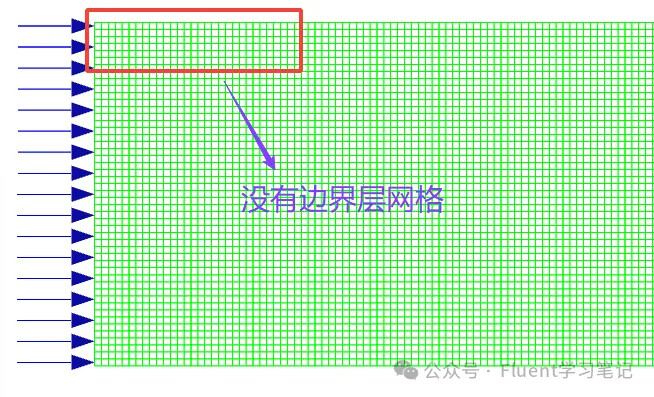
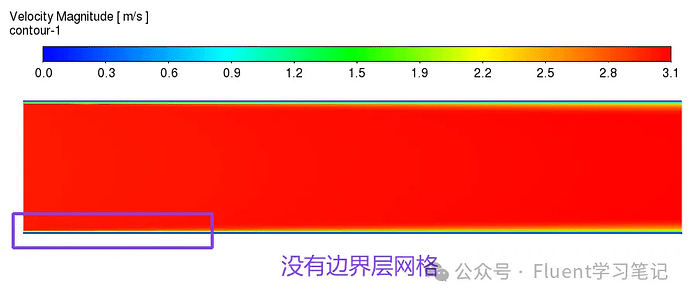
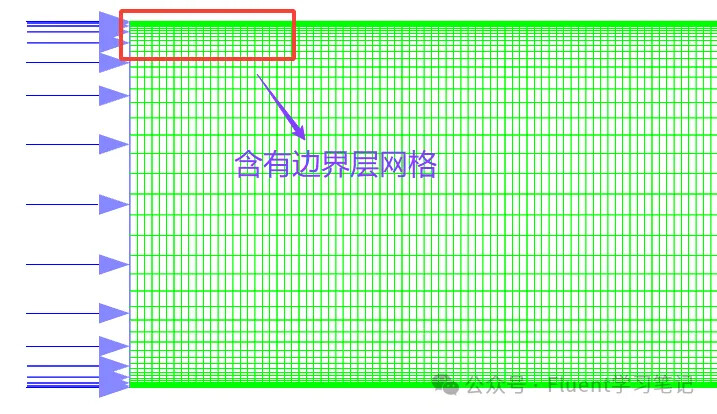
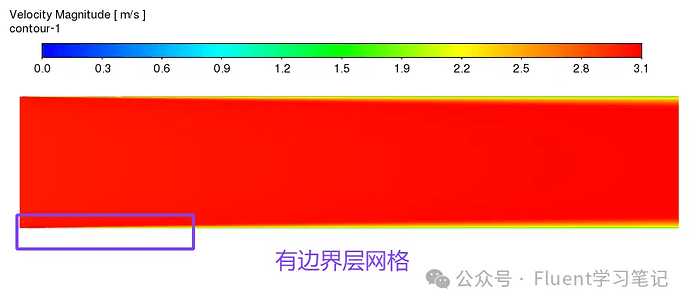
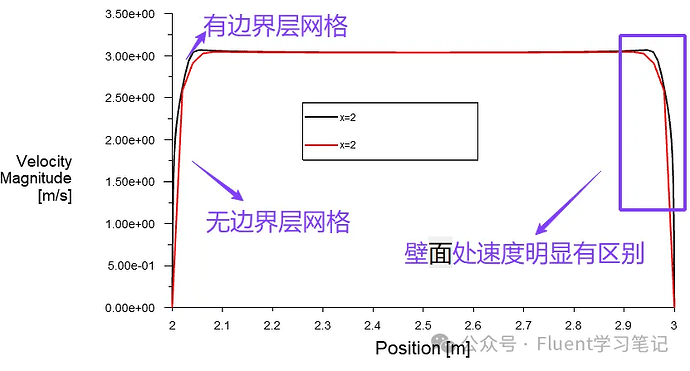
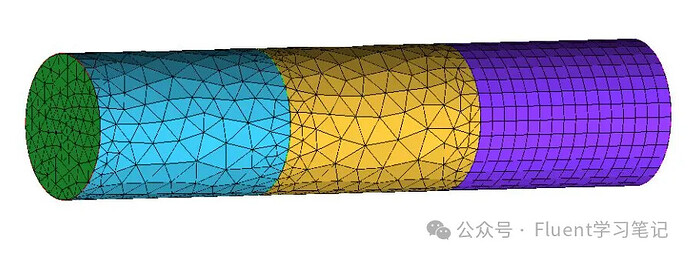
For flow inside a circular pipe where the main flow velocity is 3 m/s, most regions inside the pipe should have a velocity of 3 m/s. Near the wall, however, the presence of a boundary layer causes a large velocity gradient. The number of grid layers and grid sizes used in the boundary layer will affect the detailed velocity profile.
-
Without Boundary Layer Grids
Velocity distribution near the wall differs significantly.
-
With Boundary Layer Grids
Detailed velocity gradients are accurately captured.
3.Difference
3.2 When the Grid Density is High
Does this mean a higher grid density is always better?
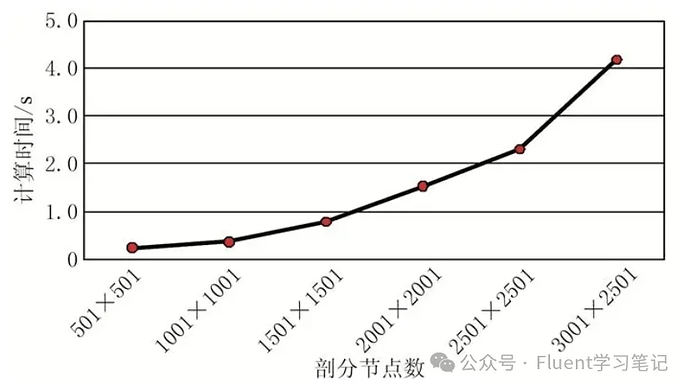
No. For one, increasing grid density significantly raises memory usage and computation time. Additionally, excessive grid density may cause convergence problems. While finer grids generally improve convergence, overly fine grids can sometimes lead to non-convergence.
3.3 Risks of Skipping Grid Independence Verification
-
Result Deviation
Coarse grids lead to larger errors, causing simulation results to deviate from reality.
-
Resource Waste
Overly fine grids unnecessarily increase computational load and simulation time.
-
Stability Problems
In complex models, the rationality of grid design can affect solver stability.
4. How to Conduct Grid Independence Verification?
1. Initial Grid Generation
- Use Fluent or other grid generation tools to create an initial grid.
- Select the appropriate grid type (structured or unstructured) based on the geometry complexity and problem type.
2. Gradual Grid Refinement
- Gradually increase grid density, e.g., by 50% or doubling the number of grid cells.
- After each refinement, re-solve the problem and record key physical quantities.
Note: The physical quantity monitored depends on the research focus. For instance:
- For air conditioning studies, monitor temperature and humidity.
- For heat transfer problems, monitor temperature, heat transfer rates, etc.
In some cases, basic physical quantities may stabilize, but the research-focused quantities may not.
3. Compare Results
- Compare results at different grid densities, focusing on key locations or parameters.
- Calculate the rate of change in results after each refinement. When relative changes are within a certain error range, grid independence is achieved.
Two Common Comparison Methods
-
Comparing average values across the entire computational domain.
-
Comparing values at specific regions or monitoring time-varying results.
4. Determine the Optimal Grid
- Once results stabilize, the current grid is deemed optimal.
- Record the grid density and refinement parameters for future use. The optimal grid balances accuracy and computational efficiency.
5. Key Points for Grid Independence Verification
-
Grid Type Selection
- Use hybrid grids for complex geometries and structured grids for simple ones.
- Use hybrid grids for complex geometries and structured grids for simple ones.
-
Boundary Layer Grids
- Refine boundary layer grids to ensure accuracy near walls, especially in regions with high gradients. Gradual refinement ensures consistency.
- Refine boundary layer grids to ensure accuracy near walls, especially in regions with high gradients. Gradual refinement ensures consistency.
-
Grid Quality Check
- Ensure grid cells have high orthogonality and low distortion to avoid instabilities.
-
Selecting Key Variables
- Choose representative physical quantities for meaningful comparisons (e.g., flow rate, pressure drop, temperature).
6. Example of Grid Independence Verification
Scenario: Pipe Flow Simulation
Objective: Analyze outlet velocity distribution.
| Grid Density | Outlet Velocity (m/s) |
|---|---|
| 10 × 50 | 2.60 |
| 20 × 100 | 2.78 |
| 40 × 200 | 2.91 |
| 80 × 400 | 3.00 |
|  |
|  |
|  |
|  |
|  |
|  |
|  |
|  |
|  |
|  |
|  |
After refining the grid to 80 × 400, the results stabilize, indicating grid independence. However, the grid increments used in this example are relatively large. Smaller increments could yield a more precise verification process.
